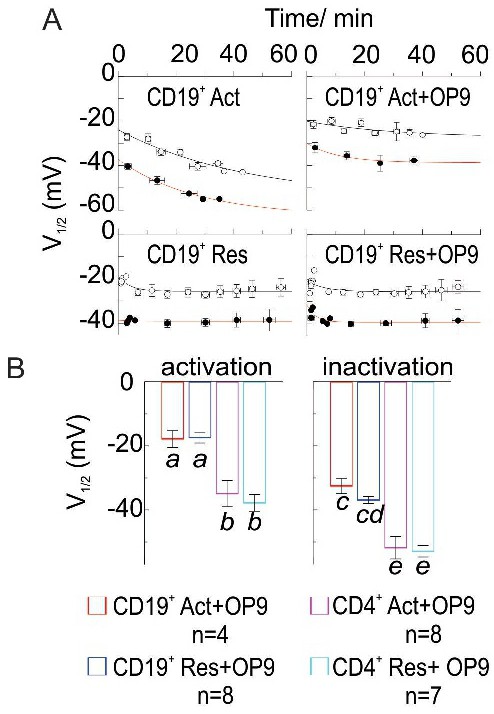
Fig. 2. Inactivation and activation of Kv1.3 current in B cells is shifted to more positive potentials as compared to T cells as a result of co-culture with stromal cells. A) Negative shift of midpoint potentials for activation (black line, hollow circles) and inactivation (red line, filled circles) of Kv1.3 current in B cells during recording in whole cell configuration, in mono- and co-cultures. B) Summary of midpoint potential values for Kv1.3 current activation and inactivation in resting and activated B and T lymphocytes, co-cultured with OP9 cells. Only the initial ones from the first record in whole cell configuration were considered. For each cell sample, activation and inactivation curves have been fitted separately and the values of fitted parameters have been averaged for each condition. Data are mean ± SE, n is a total number of tested cells from 2 to 3 different donors for each condition. Different symbols are for significantly different values, significance range from p<0.003 (CD19+ resting vs CD4+ activated) to p<0.0001 (CD19+ resting vs CD4+ resting) for the inactivation and p<0.05 (CD19+ activated vs CD4+ activated) to p<0.0002 (CD19+ resting vs CD4+ resting) for the activation process.